If you’ve ever tooled around the real estate site Zillow.com to look for a home, you know that location matters. A three-bedroom might cost 50 percent more in one area than a similar home across town.
Geographical differences exist in health care too. Rates of elective surgery (such as knee-replacement and hysterectomy procedures), for example, can be two or three times higher in some regions than others located just a few miles away.

Elective treatments are often called “preference sensitive,” because the decision about which treatment is best depends on someone’s preference. Often that someone is the clinician, and clinicians’ opinions vary widely from location to location, based on prevailing medical practices in that area.
This can result in overuse of surgery, which can be problematic for a few reasons. First, surgery is expensive. Second, there’s more risk of infection and other complications than with less-invasive treatments. Patients unaware of their full range of options often follow surgeon recommendations, costing the health care system billions of dollars annually.
To explore the prevalence of geographical variation in greater detail, the California Health Care Foundation (CHCF) made a research grant to Stanford health economics professor Laurence Baker. The focus was on elective treatments, including heart procedures, joint replacement, mastectomy, and vaginal birth after caesarean, where providing more information to patients could affect their decisionmaking around whether to opt for a certain treatment. His work revealed that rates of elective surgeries for a range of procedures in California varied widely depending on location, even after adjusting for areas with less-healthy populations, and noted that overuse is not always the issue; underuse can be a problem too.
If gathering the data was the first step, making it useful was the second. Our goal was to present the research in a clear and compelling way to prompt policymakers and the medical community to question why their areas were outliers and take action to address these differences.
Primary audiences included folks in the policy world (who often love to dig into data), physicians (who may not have realized their community was an outlier), and local reporters (interested in uncovering new stories). To build our communications strategy, we asked ourselves:
- How do we present this information in an accessible, clear, and engaging way?
- How can we get decision-makers and other interested parties to review the data and encourage them to take action?
Presenting the Data
In addition to publishing a traditional, written research report, we decided to try a more visual and interactive approach: geographic maps of health care variation. We worked with the design firm Stamen to produce the interactive map of California below. Areas that were outliers—with either many fewer procedures than the state average, or many more—were color-coded so that they could be easily identified. A slider allowed users to easily see where each community fell on a continuum, either above or below the state average for 13 different procedures (subsequently expanded to 24).
While not the first of its kind (the Dartmouth Atlas has created similar maps for years), the ability to sort data based on community and procedure, and rank-order locations via a pulldown list was cutting-edge and designed to appeal to health policy researchers and reporters.
Click here to view the interactive version.">
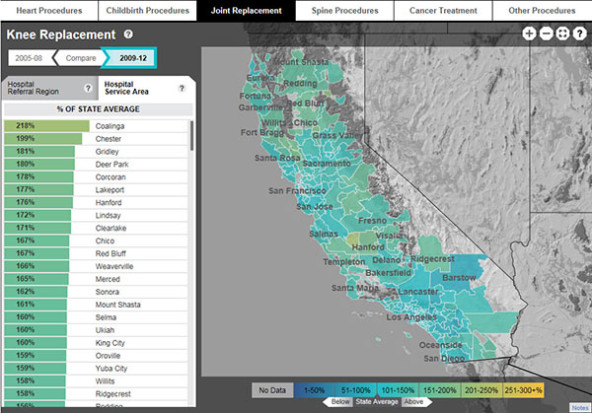 Mapping variations by region provided an immediate way for audiences to grasp information. (This is an updated version.) Click here to view the interactive version.
We now had a powerful communications tool to raise questions about the appropriate rate of elective surgeries in California; next we needed to spread the word. We hoped the data would generate meaningful press coverage, and in turn, wider interest in the map.
Leveraging Assets
Meanwhile, our communications team had another valuable tool in its arsenal: the Center for Health Reporting (funded by CHCF and operated by the USC Annenberg School for Communication and Journalism), whose investigative work was available for free to all newspapers in California.
The plan was this: CHCF would provide embargoed access to the data behind the map to one of the center’s reporters. The reporter would identify a story based on the research, and conduct local interviewing and reporting. The center would then pitch the story as an exclusive to one of the many news outlets across the state with which it had a relationship. From there, CHCF’s communications team could give research access to other news outlets.
In early September 2011, The San Francisco Chronicle published the first story about the map, reported by the center’s Emily Bazar:
Clearlake, Lake County—This rural Northern California town known for its scenic, bass-filled lake now has another distinction: Clearlake-area residents have been undergoing two common heart procedures more than any other Californians, posting rates so high that they exceed most other regions by multiple factors ...
This started a domino effect. Bazar’s story caught the attention of Victoria Colliver, a longtime health reporter for the Chronicle who was familiar with the foundation’s work. Less than two weeks later, she published her own story on the geographic variation in caesarean sections performed at hospitals in various Northern Californian communities.
Seeing this story, Hank Sims, a reporter from the Humboldt County-based Lost Coast Outpost, published an article that focused on the local high rates of elective procedures in Humboldt.
This marked a turning point, as his story made its way into the hands of Betsy Stapleton, a former nurse practitioner and Martin Love, CEO of the physician’s group Humboldt Del Norte Independent Practice Association (a local organization that contracts with independent physicians and provides services to managed care organizations on a negotiated contracted basis).
Stapleton and Love contacted CHCF and asked if we might support a local effort to understand what was driving the high rates of surgery. The result was the Humboldt Surgical Rate Project, which we created to help understand and address the question of surgical variation in Humboldt. The community formed three committees—one for community members, one for specialists, and one for primary care practitioners—and decided to bring in Dr. Baker to discuss his rate report, and then invite clinical experts from outside the area to discuss the findings with each committee. The end goal was to produce recommendations to address the high rates and hold a final meeting to reach community consensus.
An important finding from the community’s work was a communications disconnect between primary care physicians, specialists, and patients when making decisions about elective procedures. A busy primary care physician would provide a referral to a surgeon specialist, assuming the specialist would also discuss non-surgical alternative treatments. The surgeon would assume the physician had reviewed non-surgical treatments with patients, when in fact the patient remained in the dark. This finding led to a new grant from CHCF to the Humboldt Independent Practice Association to establish a centralized, “shared decision-making” process.
The impact of this work lives on. The Humboldt physicians became engaged with the question of variation. And we now have major health care purchasers—including CalPERS, Covered California, and Medi-Cal—looking at the overuse of elective procedures through a statewide work group.
Maribeth Shannon, the CHCF program director who led the project, said: “The truth is that philanthropy is strategic and opportunistic. We are never quite certain a proposed intervention will make a difference, and we often wait years to see an impact. What catalyzed action here was our ability to visually tell a compelling story and get it into the hands of people motivated to do something about it.”
For other foundations aiming to get people thinking about a topic, we can offer three lessons. First, identify the best tool available to convey the information you have; in this case, a color-coded, interactive map enabled audiences to understand the big idea without too much work. Second, pull multiple communications levers—with the media and others—to get your work into the right hands. And finally, when your data is compelling and the tools connect, be willing to provide new grants and other resources to help those on the ground focus on change.
Support SSIR’s coverage of cross-sector solutions to global challenges.
Help us further the reach of innovative ideas. Donate today.
Read more stories by Sandra Hernández & Steven Birenbaum.