
 (Illustration by iStock/smartboy10)
Though Black Americans make up 13 percent of the country's population, they account for 22 percent of the deaths connected to COVID-19, according to the US Centers for Disease Control and Prevention (CDC). We see this disparity—another manifestation of decades of systemic racism and deeply entrenched inequity in America—in individual cities and states across the country. In Chicago, 30 percent of the city's population is Black but they have accounted for 45 percent of COVID-19 deaths. In Louisiana, 32 percent of the state's residents are Black and they have suffered 53 percent of the COVID-19 deaths.
Public health officials trying to respond to this racial disparity in COVID-19 outcomes may understandably resort to solutions that are as broad and blunt as the available data on the deaths, which typically account for little more than racial background. However, the responses that will be most effective may not be as universal as the problem appears to be for Black Americans. The best responses can and should vary from person to person or community to community, according to experts, from the authors of a recent viewpoint in the Journal of the American Medical Association to researchers writing in the July 2019 issue of Proceedings of the National Academies of Science.

Yet health officials will be confounded if they go looking for more precise data to facilitate more targeted and effective responses. Granular race, ethnicity, and socio-demographic data related to COVID-19 are needed but not widely available, as Merlin Chowkwanyun, and Adolph L. Reed noted in The New England Journal of Medicine. There is little if any information on the relationship between COVID outcomes and other important demographics, such as socio-economic status.
This lack of perfect and complete data on COVID and race in the United States puts lives at risk. It inhibits the creation of effective, nuanced, and targeted interventions. One option is to collect more and better data, a difficult process that is slowly rolling out. Effective August 1, laboratories will be required to include demographic data when they report coronavirus test results to the government. In addition, the Equitable Data Collection and Disclosure on COVID-19 Act has been introduced in the US House of Representatives and Senate to require and fund the Department of Health and Human Services to report detailed demographic data about the coronavirus, such as race, socio-economic status, and disability status.
While progress is slowly being made on that front, we cannot wait to act. A simpler and faster way forward is to leverage existing data sets. That's exactly what our team did.
We first examined the many factors that contribute to a community’s COVID vulnerability to generate a single index for neighborhoods across the country. We then examined this index through the lens of racial demographic data to understand how neighborhood-level and county-level vulnerability affect Black Americans. And by looking at the factors that drive vulnerability for Black Americans and how those factors differ across communities, we developed recommendations for targeted interventions.
Creating the Index for a Community's Vulnerability to COVID-19
We know that the risks COVID-19 poses to Americans are vast and complex, amplified by numerous socio-economic, health, and structural factors that are not equally distributed across the country. Some of these factors are already captured in the CDC's Social Vulnerability Index (SVI), which scores each county and neighborhood (also referred to as a census tract) in the United States on its vulnerability to natural or human-caused disasters based on four themes: socio-economic factors, household composition (age and disability), minority status and language, and access to housing and transportation.
However, there are vulnerabilities specific to COVID-19 that were not captured in the CDC’s index. Two elements were missing: epidemiological factors (population density and chronic conditions) and health care system factors (spending and infrastructure). To calculate these, we used existing data sets, such as the number of intensive care units per county, which Kaiser Health News compiled with information from the Centers for Medicare & Medicaid Services (CMS). We also looked at the percentage of adults who had ever been diagnosed with diabetes, which PolicyMap estimated with data from the CDC’s Behavioral Risk Factor Surveillance System (BRFSS).
With data on all six types of vulnerability factors in hand, we created the COVID-19 Community Vulnerability Index (CCVI) to make it easier to identify which communities—at the state, county, and census tract levels—will struggle the most when the pandemic strikes them. A community’s vulnerability score ranges from 0 to 1 and reflects 34 indicators grouped into the six equally weighted themes. There are five categories of vulnerability: very low, with a score from 0 to 0.19; low (0.2 to 0.39); moderate (0.4 to 0.59); high (0.6 to 0.79); and very high (0.8 to 1).
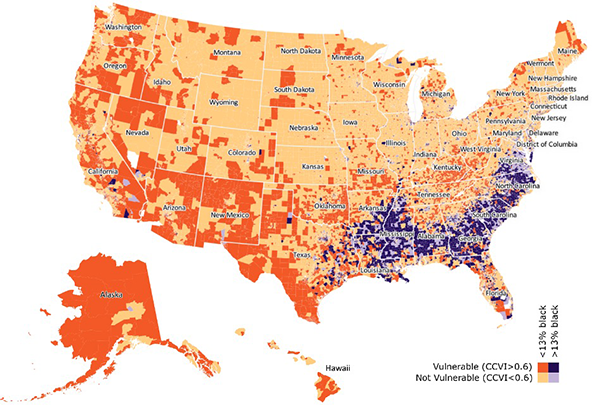 Census tracts with higher-than-average percentages of Black Americans are often more vulnerable to COVID-19.
With the CCVI, we can identify the neighborhoods—the census tracts that typically are home to about 4,000 people—in the United States that are most vulnerable to COVID-19. Our analysis reveals that 38 percent of Americans live in vulnerable census tracts, which are those that have a CCVI score of 0.6 or higher.
But this is only part of the story. By overlaying the CCVI with race data, we find that Black Americans disproportionately live in communities that are more vulnerable to COVID-19. In fact, our analysis shows that 60 percent of Black Americans live in COVID-vulnerable communities (CCVI of 0.6 or higher). Only 34 percent of white Americans are in the same situation.
Geographic Nuances of Vulnerability
Understanding vulnerability at just the county level will miss important racial differences. For example, only 22 percent of Black Americans live in vulnerable counties. But 60 percent of Black Americans live in vulnerable census tracts—neighborhoods that often are part of non-vulnerable counties. We must take a much more localized approach to paint a more accurate portrait of risk, particularly within cities, in which 88 percent of Black Americans live.
One example is Cook County, home to the city of Chicago. The county has a CCVI score of 0.77, putting it in the vulnerable category. But this number masks the variability in vulnerability across the city. Nearly 50 percent of census tracts within Chicago are highly vulnerable (with a CCVI score of greater than 0.8). Within these census tracts, Black residents make up 77 percent of the population, even though only 30 percent of Chicagoans are Black. Meanwhile, in the 30 percent of the city’s census tracts that are non-vulnerable (with a CCVI score of less than 0.6), only 8 percent of the population is Black.
Our nation’s capital presents an even starker picture. Washington, DC, has a CCVI score of just 0.21, indicating low vulnerability. However, 40 percent of its census tracts are vulnerable, and Black residents make up 92 percent of the population of these vulnerable neighborhoods, despite being only 48 percent of DC’s overall population. In other words, a Black person in DC is, on average, 32 times more likely to live in a vulnerable community than a white person.
Variations in the Threats Facing Black Communities
Breaking the CCVI down by its composite themes reveals important variations in the causes of vulnerability faced by Black Americans in cities. Take, for example, two different neighboring census tracts in Washington, DC, both of which are notably vulnerable and have large Black populations relative to national averages.
Tract A has a CCVI score of 0.78 and is 94 percent Black. It is in Ward 7 in northeast DC. Amid the factors affecting its CCVI score, household composition and disability stand out. A significant 26.5 percent of this tract's residents are disabled, which is more than double the national average. The pandemic can make it more challenging for people with disabilities to seek needed care, and some disabilities have been shown to increase the deadliness of COVID-19.
Tract B has a CCVI score of 0.94, is 94 percent Black, and sits next to tract A in Ward 7. Its vulnerability mainly arises from housing type and transportation factors. Roughly 24 percent of tract B's residents live in multi-unit housing, which is twice the national average. And 46 percent of them have no access to a vehicle—five and a half times the national average. Eight percent live in crowded households in which there are more people than rooms, which is about twice the national average. Crowded conditions—whether at home or on public transportation—can make it more difficult to practice social distancing.
The CCVI data also shed light on disparities that are consistent, such as those relating to socio-economic status. The average Black American lives in a census tract with an average per-capita income of $26,244 and pre-COVID-19 unemployment rate of 8.8 percent, compared to $35,953 and 5.4 percent for the average white person. Lower-paying jobs are associated with an inability to work from home, putting these communities at greater risk of exposure. Financial stability has been found to be a key predictor of social distancing behavior during COVID-19. Low-paying jobs and high unemployment also indicate that community members will be underinsured and less able to seek care when they fall sick. Furthermore, low socio-economic conditions pose a number of other barriers to people's health, especially during a pandemic.
Housing and transportation are also commonly shared vulnerability factors facing Black Americans. The average Black American lives in a census tract that has more residents in multi-unit housing or in group quarters, such as prisons, nursing homes, or mental hospitals. Communities with more Black residents also have more people who lack access to a vehicle, forcing them to rely on often-crowded public transportation. These structural conditions make social distancing—a key preventative measure against the pandemic—far more challenging.
Urban Versus Rural Areas
Eighty-eight percent of Black people in rural areas live in vulnerable census tracts, compared to just 55 percent of white rural Americans. And in rural areas, we see the same socio-economic disparities captured in the CCVI at the census tract level that exist in urban areas—the average rural Black American lives in a census tract with higher unemployment and lower per-capita income.
Rural Black Americans, on average, also live in counties with 6 percent less health care spending per capita and 13 percent less public health emergency spending per capita than their rural white counterparts. Additionally, rural Black Americans see 7 percent less health care spending per capita than urban Black Americans. No such difference exists for urban and rural whites.
Targeted Interventions
Deeply entrenched inequities leave many Black Americans and communities fundamentally more vulnerable to COVID-19, but important and often overlooked variations in that vulnerability demand more precise and localized solutions. Here are some concepts to consider when designing targeted interventions:
- Pay attention to the neighborhoods most at risk. Avoid one-size-fits-all fixes that fail to acknowledge the specific needs of the communities that will bear the biggest burden of the pandemic. This can mean a range of initiatives, from ensuring testing is available at trusted and accessible community locations to providing healthy meals in areas where food insecurity may be a challenge.
- Tackle long-ignored structural challenges. There are many facets to the vulnerabilities Black Americans face, and they are the products of years of discrimination and neglect that have left their communities ill-equipped to fight COVID-19. We must recognize that many communities will remain more vulnerable to COVID-19 and its long-term impact until we make progress on equitable housing policies, investments in public schools, criminal justice reform, economic justice, access to health care, and other issues.
- Send extra support to rural areas. Though stronger health care systems are needed across the nation, the need is particularly urgent in rural areas, where numerous hospitals have closed over the last decade. Many residents have been forced to travel long distances to access care. We must build up the capacity of existing hospitals and deploy community-based care to make up for the dearth of well-resourced health care facilities.
- Prioritize the deployment of testing, contact tracing, and supported isolation (TTSI) in vulnerable Black communities. The only way we can safely reopen America is by deploying a TTSI strategy to suppress the coronavirus. Given limited resources, this approach must target regions where it will have the greatest impact. We have found that a TTSI strategy focused on areas with low virus prevalence but high vulnerability—many of which are rural communities with a large proportion of Black Americans—will save more lives with limited resources.
Act Now
The data we have woven together to create the CCVI confirm a sadly familiar and alarming truth: Community-level vulnerability to this pandemic is intrinsically tied to race because of the systemic inequities that pervade the United States. But this data also help identify precise solutions, from neighborhood-level investments in cities to targeted testing strategies in rural areas, to help Black Americans as they disproportionately bear the burden of this crisis.
We acknowledge that by restricting our focus to Black populations and not others—such as Latinx Americans or Native Americans who are also dying at disproportionate rates—we are shedding light on only part of the picture. But by making the CCVI and the data behind it freely available, we hope that more organizations and individuals will have a tool to ensure vulnerable populations of all types get the help they need. The inequities exacerbating this crisis for many Americans are deep and multifaceted. Our response must be as well.
Support SSIR’s coverage of cross-sector solutions to global challenges.
Help us further the reach of innovative ideas. Donate today.
Read more stories by Yael Caplan, Nick Stewart, Peter Smittenaar & Sema K. Sgaier.