

Innovation Accounting: A Practical Guide For Measuring Your Innovation Ecosystem's Performance
Dan Toma & Esther Gons
304 pages, BIS Publishers, 2022
Taking decisions with respect to what the next investment in innovation should look like, can quickly become a turf war for resources and prestige in the absence of an unbiased way to get transparency over the existing commitments.
However, managing a portfolio of innovations is easier said than done. The fact that innovation comes in all shapes and sizes, and a company is most likely investing simultaneously across the entire spectrum, it’s not making things any easier either. Looking at the existing investment portfolio through different lenses rooted in various questions can take a lot of the guessing and personal biases out of the decision-making process.
For example, some leaders might need to know how much investment is going towards each strategic option listed in the company’s strategy in order to make sure that what is stated in the strategy as being a priority, actually gets a proportional investment. For example, what percentage of investment is going towards ‘decarbonization’ and how much is going toward ‘quantum computing’ given that our company is aiming for ‘net zero’ by 2030.
Other leaders might be interested in the potential of the total addressable market size the ventures in the portfolio are paying in, in order to make sure that the company is playing in big enough markets given the growth goals set in the strategy.
While other leaders might be interested in the potential cash-flow multiple of the ventures in the innovation portfolio in order to compare them with the core business’ performance or in order to only pursue the ones that have a cash-flow multiple above a certain set goal.
Below, Dan Toma and Esther Gons present three lenses through which an innovation portfolio/funnel can be analyzed starting from the question that each perspective will offer an answer.
* * *
Lens 1: Deadhorse and Unicorns
Is our innovation portfolio going to be profitable?
If you want to look at your innovation funnel from the perspective of potential future profitability, we would encourage you to use what we call a “stable overview.” Let us explain why we use the term “stable” first and then we will show you how to go about creating your own “stable overview.”
In the startup world, highly successful startups that reach a valuation of $1 bn. are called unicorns. Meanwhile, incremental innovation is usually referred to as “faster horses,” inspired by Henry Ford’s quote: “if I had asked people what they wanted, they would have said faster horses.”
With that in mind, we propose segregating ideas in the funnel according to their risk-adjusted value-to-cost ratio in the following types:
- Below 1x: Dead horse: ideas that have a value to cost lower than 1, meaning they are not profitable.
- 1 to 2x: Faster horse: ideas that have a value to cost ratio from 1 to 2. Essentially these ideas are either only going to break even or going to offer limited profitability.
- 2 to 10x: Workhorse: ideas that will offer anything from 2x to 10x return.
- Above 10x: Unicorns: ideas that have a risk-adjusted value to cost of 10x and above.
You can now take your stable of ideas and create a graph. Use the 0Y axis to identify where each idea sits on the range of “dead horses” to “unicorns.” The 0X axis shows the level of confidence which your Venture Board has in each idea. It’s also advisable to create a separate diagram for every maturity stage you want to analyze as this will allow for real “apples-to-apples” comparison between ideas that are of similar maturity.
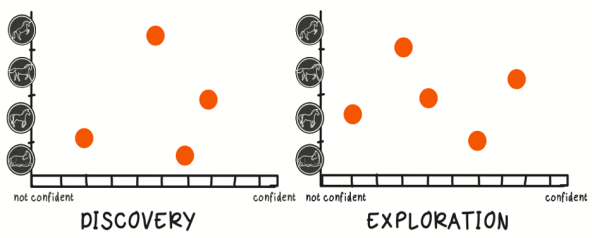
It won’t take long for you to spot a pattern. Ventures will tend to follow the right path as they mature. This is expected, as the value to cost estimate is getting more realistic as the maturity of the venture increases. A proxy for a venture’s maturity is the confidence the Venture Board has in the venture.
We would encourage you to only look at ventures which are past a certain maturity level. Ventures which are too “early stage” would be too volatile to produce a meaningful picture (the value to cost ratio and the confidence can vary wildly from week to week).
As you can see, the only information required to create an accurate picture of the funnel already exists in the Funnel Dashboard we spoke about in the previous chapter.
Color coding can also be used in order to highlight the expected portfolio direction of each of your initiatives. For example, core initiatives could be color-coded blue, adjacent red, and transformational yellow.
Lens 2: Investment per Strategic Option
Is our investment in innovation in-sync with our strategic aspirations?
Another lens you can use to analyze your innovation funnel is the one on distribution of investments relative to strategic priorities.
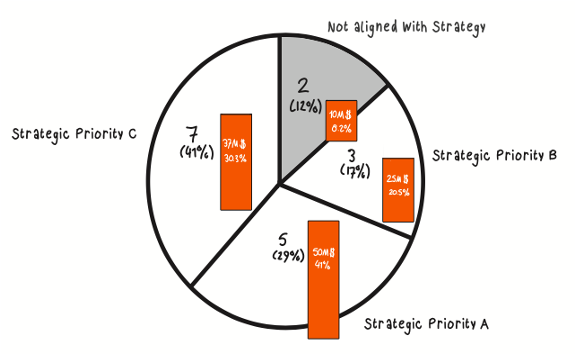
As we’ve seen earlier, your strategy should be influencing the funnel. One of the questions that you should constantly ask is: is our company’s Innovation Thesis being applied? To check if that’s the case in your company, you can calculate the percentage of ventures or money invested in respect of each strategic priority outlined in your company’s Innovation Thesis.
A negative answer to this question, particularly if a high percentage of ideas don’t connect with any strategic priority, is a cause for concern. Possible causes could be: the Thesis not being communicated, being incomprehensible or the Venture Board not applying the Thesis in the decision-making process.
Lens 3: Addressable Market Size
How big are the markets our new ventures are playing in? Are they playing in big enough markets for our company to meet the aspirational growth goals?
Another lens you can use to look at the innovation funnel is the one on addressable market size. Essentially you try to understand the target market for each of your innovation funnel initiatives. Aggregated at funnel level, this view can be useful in understanding the long-term potential of your innovation exercise.
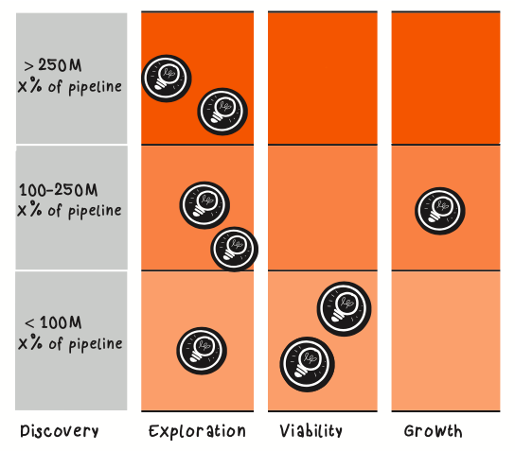
Furthermore, this lens can help you understand if your current innovation investments are following the Innovation Thesis; in particular with respect to the market size the thesis states that ventures should be in. Say for example your company only wishes to pursue initiatives in markets bigger than $150 mil. and they make this very clear in the Thesis. Analyzing the funnel through this lens will help you understand how many ideas in percentage terms follow this Thesis guideline. A high percentage of ideas not following the guidelines can prompt questions around how well the thesis was communicated, understood and put into practice.