

There are over 10 million non-government organizations worldwide. Donors do not have enough time, attention, or cognitive bandwidth to evaluate and consider their relative merits when deciding to whom and how much to give.
Even when donors do narrow down their options to, say, charities working on certain issues, with specific communities, or in particular geographic locations, there are still many hassles when it comes to researching and comparing organizations. Objective information about effectiveness and impact is often difficult to find, and it is not communicated in an easily understandable and comparable way.

In both cases, donors often make donation decisions based on limited information. They give based on emotion or in reaction to a clever appeal. Or, perhaps worse, they give ad-hoc or randomly. Others opt not to make any donation at all, leaving the social sector—our world’s safety net—at risk of financial failure.
But what happens when donors are provided with accessible, standardized, and objective metrics, and can see charities presented side-by-side?
Short answer: They give more effectively to charities making a measurable impact.
A Theory for Better Decision-Making
People often wonder—do metrics really matter?
Over the past eight years, the Impact Genome Fund (Impact Genome), a publicly funded research initiative of the Tides Foundation, has been pioneering standardized, objective impact metrics for all nonprofits. We’ve collected metrics on thousands of charities and consolidated them in our nonprofit registry. These metrics include information that could be useful to donors in making more informed decisions. Among them:
- the specific outcome the charity aims to achieve
- the number of beneficiaries that achieved the outcome in the past year
- whether the program operates in a high-need area
- the cost of producing a single outcome
- the quality of impact evidence
The theory we wanted to test was whether standardized comparable impact data—specifically, the five metrics above—is critical to solving an overarching problem in the charitable giving space: choice architecture. Choice architecture is the design of different ways in which choices can be presented to decision makers, and the impact of that presentation on decision-making.
The choice architecture for funding decisions is typically weak. The overwhelming number of charities, the inconsistency of the type and amount of information available, the inability of donors to compare options easily, and the lack of salient objective metrics for comparison make it difficult for donors to make an optimal donation decision.
But does our theory hold up? If donors have access to better choice architecture, will they change their giving?
Testing Our Theory
Impact Genome recently partnered with ideas42, with funding from Fidelity Charitable Trustees’ Initiative, to test whether the availability of these types of metrics and a better choice architecture had any influence on giving behavior. As a nonprofit committed to bettering the world through behavioral science, ideas42 uses insights from human behavior—why people do what they do—to help improve lives, build better systems, and drive social change.
Together, we tested the influence of choice architecture on donation decisions in terms of both which charity to donate to and how much to donate. The study used a multi-methodological approach carried out with the AmeriSpeak panel at NORC at the University of Chicago—a representative, probability-based sample of more than 1,500 Americans.
Test Structure
We ran a controlled experimental study that involved a simulated decision using real money. Participants were told they would go through eight rounds where they would decide to keep or donate $5 to one of the charities they saw. To make the decision feel less hypothetical, they were told there was a random chance that one of those rounds would be carried out with real money. In that round, whatever amount they decided to donate would be sent to the charity they selected, and the amount they decided to keep would be added to their base payment.
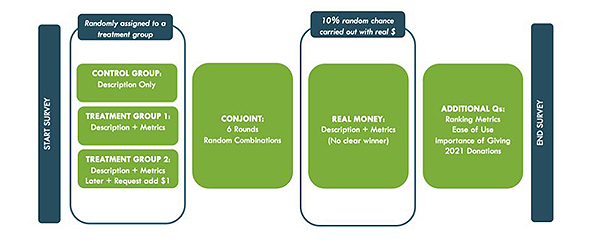
First, participants were shown three hypothetical charities with various amounts of information. Participants were assigned to one of three treatment groups and given $5, which they could keep or donate as they saw fit. They were then asked to select the charity they were most likely to support and how much of their $5 they wanted to donate.
The Control Group saw only the charity descriptions. Treatment Group 1 saw both the charity descriptions and objective metrics, including the number of beneficiaries that achieved the outcome, the cost of producing a single outcome, whether the program operates in a high-need area, and the quality of its impact evidence. Treatment Group 2 first saw just the charity description. After they made their decision, they were given additional information about the cost-effectiveness of the charity and asked if they wanted to increase their donation by $1.
We also included a conjoint analysis with six survey rounds. Conjoint analysis is a survey-based statistical technique traditionally used in market research to quantify how consumers relatively value the attributes of a product or service. In each survey round, participants were shown two hypothetical charities with a random combination of metrics. Participants selected their preferred option of the two and then indicated if they would be willing to donate that round’s credit to the selected charity.
Finally, participants saw three real, but anonymized, charities from the Impact Genome Registry. Their descriptions and metrics were shown, but there was no clear winner. For a random 10 percent of participants, actual payments were made for this round. We needed to include this round to fulfill our promise of a random chance of real payments.
At the end of the survey, respondents were asked additional questions regarding the importance of various metrics, their experience using the metrics to make decisions, and their personal experience with charitable giving. This section included additional charity attributes (such as charity cause) to see how they compared to the more objective metrics.
Donors Made Different Giving Decisions
In short, the study found that providing objective metrics shifted giving decisions to more effective charities when donors could compare charities side-by-side and there was a clear winner. Moreover, the majority of respondents (74 percent) said that they found it useful to compare charities using a similar framework.
Digging a little deeper, here is some of what we learned:
Does differential performance on metrics influence who gets the donation?
Yes, a lot… when donors can compare charities side-by-side and there is a clear winner.
Providing objective, comparable metrics to donors at the time of the donation decision led to an 80 percent increase in the number of people that selected the most effective charity. In our study, donors were able to easily compare three giving options with a clear winner, and in that setting, metrics had a big effect on donors’ choices.
Do metrics increase the size of the donation?
The results were inconclusive, and more research is needed.
When comparing two rounds—one with a clear winner based on the metrics and one without a clear winner—there was no statistically significant difference in the amount of money donated.
That said, respondents who indicated they were confident in their ultimate choice of which charity to support donated statistically significantly more money. Moreover, respondents who agreed with the statement “it was easy to decide which charity had the best combination of features” donated statistically significantly more money.
Approximately two-thirds of respondents (61 percent to 64 percent) gave the maximum donation ($5) in any given round. This was much more than we had anticipated based on previous research. Additionally, there was no statistically significant difference in the amount of money donated between the treatment groups that did and did not see the charities’ metrics.
Our theory is there may have been a ceiling effect—a research term for when participants in a study all cluster around the high end. Because the amount participants had to give away was so small, many opted to give it all away every time. It is possible that if respondents had more money to donate, they would have shown more variation in how much they gave.
Tying this finding to the one above, we found that providing metrics changed who donors gave money to, but not how much money they gave. Though, as we noted, the ceiling effect could mean there is more nuance in their giving decisions than our study could detect.
Do donors care about using metrics to compare charities?
Yes, they say they do.
When asked directly if it would be helpful to be able to compare charities using a similar framework when making donation decisions in their day-to-day lives, 74 percent of respondents agreed.
Importantly, as the previous findings show, their behavior agreed.
Why This Matters If You’re a Donor
It’s probably obvious that the findings were important to those of us running the study. It showed our theory was correct. The work we’ve been doing to provide accessible, comparable, objective metrics can and will help donors make a bigger impact.
But if you want to maximize the impact of your giving, this study should be important to you too.
Why?
Previous work at ideas42 has shown that many donors tend to engage in emotional, ad-hoc giving in response to requests, rather than proactive, strategic giving. This can lead to misalignment between their ideal goals and their actual donation behavior. Now, we know there is a better way. Using standardized, comparable metrics can help you develop a strategic approach: if you have the information you need, you can shift your donations to the most effective charities, thus maximizing your positive impact on the cause(s) you care about. The ability to make a bigger impact comes from being able to understand not just what charities do, but how well they do it.
Accessible, comparable, and objective metrics are important for institutional funders as well. Bespoke impact evaluations are expensive and can be burdensome on nonprofits if each funder wants a slightly different measurement of effectiveness. Creating standardized metrics across all charities steers us away from less meaningful metrics like overhead vs direct costs, and toward metrics that better capture outcomes—ultimately, the change that we want to see in the world.
The Bottom Line
With this work, our ultimate goal has been to provide data so that all donors can more effectively invest in social change and finally solve some of the world’s most intractable problems. Our study showed that making it easier to compare giving options and giving people access to the data they need does change the way they give. It makes it possible for donors to use their resources better, give to effective charities, and make a bigger impact.
Read more stories by Heather King, Marisa Nowicki, Liz Noble, Doug Palmer & Jason Saul.