

Evaluation should be a way to engage in ongoing learning and continuous feedback. To be really helpful, this feedback must be grounded in an interpretation of data that is contextualized by comparisons. In other words, nonprofits need to know what they’re being compared to, what their results really mean based on those comparisons, and how to use that information to make the organization better. It’s a vital line of inquiry, but the answers aren’t always as clear as they might seem at first glance.
In our measurement work at MDRC, an education and social policy research organization dedicated to learning what works to improve programs and policies that affect the poor, we often use a framework of two categories, each with two comparatives, to think about this. The first category delineates the services you provide—those practices your staff perform. The second category is outcomes, which encompasses the people you serve and what happens to them as a result of your services. In both of these categories, you can make internal and external comparisons.
Not just different, better

When considering an organization’s services, first we talk about fidelity of implementation. Are your people in the field doing what they're supposed to be doing, or at least what you think they're supposed to be doing, as good practice? This is an internal comparison—services provided compared to expected services based on your organization’s service model. The second comparison is of the services your staff provide against what other organizations provide in the same field—an external comparison. We describe that comparison as service contrast (or treatment contrast). Put bluntly, the question here is: Are we doing stuff that's different—or maybe even above and beyond—what’s already out there?
The same internal and external comparisons exist for the outcomes category. For the populations you serve, how were they doing previously? For instance, are kids now scoring better on a reading test than they used to? Are more of them graduating? Or is the current cohort of students doing better than prior cohorts? These internal comparisons focus exclusively on populations you serve or have served, and tell you about improvement in their outcomes over time. However, external comparisons against populations you have not served are more likely to produce information that answers the question: What kind of difference are you making, above and beyond what would have happened otherwise? In the evaluation world, that’s what defines impact.
The distinction between internal and external comparisons—fidelity versus service contrast, and outcomes versus impacts—is critically important to understanding the difference your program is actually making. If you’re running a program with fidelity and seeing improvements, it may seem like a win—but not necessarily.
To illustrate what we mean, let’s take MDRC’s random assignment evaluation of high school career academies—career-themed, smaller learning communities within high schools. The evaluation confirmed our suspicions in some respects, but we also encountered some massive surprises. Here’s a look at how we applied this framework and our findings.
Unexpected graduation impact
As expected, graduation rates were lower when fidelity to the service model was lower. Students graduated 85 percent of the time at high-fidelity academies, 72 percent at moderate-fidelity academies, and 71 percent at the lowest-fidelity academies.
We might have predicted higher rates at the top of the scale and lower rates at the bottom, even if we expected the difference between low- and moderate-fidelity sites would be greater. But a different story appeared when we changed the focus of our “compared to what?” question. In this case, we moved beyond the internal comparison of how different groups of academy students were doing to compare the graduation rates of academy students against a control group of students. The control group students were within the same high schools but not enrolled in the career academies—an external comparison.
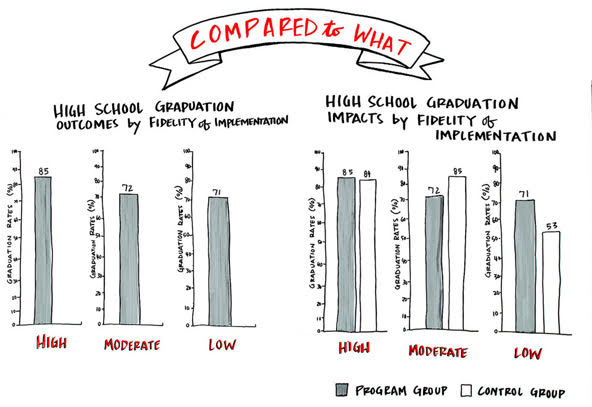 Graduation rates without a comparison seem to map to expectations, but introducing a control group showed that moderate-fidelity sites were underperforming, while low-fidelity sites were having more impact.(Image by Karyn Knight Detering, Collective Next)
Students were assigned via a lottery-like process to enter career academies (academy group) or pursue other educational programs in their high schools (non-academy control group). Control group students’ graduation rates were essentially the same as those of academy students in high schools with high-fidelity career academies (84 percent versus 85 percent), much higher in moderate-fidelity high schools (85 percent versus 72 percent) and much lower (53 percent to 71 percent) in schools with low-fidelity academies.
Finding an explanation
How does one explain these numbers? We don’t know for sure, but in the schools with moderate-fidelity academies, the story we usually tell is about overreach: Maybe these schools were just trying to do too much, and implementing a career academy stretched them too far. The schools with high-fidelity academies are potentially schools that do lots of things well, so students both within and outside of career academies had access to similarly good educational options. But it was in the high schools implementing career academies with low fidelity where there was the largest difference between academy students and non-academy control students, thus the greatest impact. Why?
On its face, it seems counterintuitive that the places that struggled the most with the program were the places where the program made the biggest difference. In our studies, we often find that the biggest impacts occur in the places where it is hardest to do the work. Those challenging sites are often where you can actually make a significant difference, because the “compared to what?” situation is weak, and there is greater need for the services you provide.
And those can be the most delightful kinds of evaluations—ones with findings that (while not always expected or pleasant) can lead to valuable insights into where and how a program does or does not achieve results, which in turn can inform program improvement. This is one example of how measurement and data can have a direct influence on human well-being.
Read more stories by William Corrin & John Martinez.