

Startup Myths and Models: What You Won't Learn in Business School
Rizwan Virk
288 pages, Columbia Business School Publishing, 2020
When I was at Stanford’s Graduate School of Business and at MIT’s Sloan School of Management, I marveled at how my economics professors could illustrate many different concepts using simple supply and demand curves. The important thing about these curves, my professors would remind us, was not the specific values, but rather the shape and direction of the curves.
Unfortunately, these models were meant for companies with cash flow and for efficient markets, both of which don’t apply to startups.
This article presents an alternative model, called the Startup Market Lifecycle, that I have observed from participating in startups through multiple boom and bust cycles over 25+ years.
Although I have been involved in many startup web cycles (dot com boom, client/server, web 2.0, etc.), it wasn’t until the mobile gaming market emerged from the last financial crisis that I began to see a pattern that indicated a common evolution of different startup markets.
As the current pandemic and financial crisis abates, new, nascent tech markets will emerge, like mobile gaming did in 2008 with the release of Apple’s App Store, and some of those will become multi-billion-dollar mature markets, as mobile gaming did over the next decade.— Rizwan Virk
It’s the Stage of the Market
Although every startup market is different, markets tend to go through similar stages, usually with characteristics distinguishable characteristics defined by different actors in the startup scene—including entrepreneurs, angel investors, institutional investors such as venture capitalists, the technology press, as well as strategic investors and acquirers.
Figure 1 shows the basic version of the Startup Market Lifecycle, which shows the stages of evolution for startup markets and the various curves. The important thing about these curves are the shape and direction, more so than the specific values.
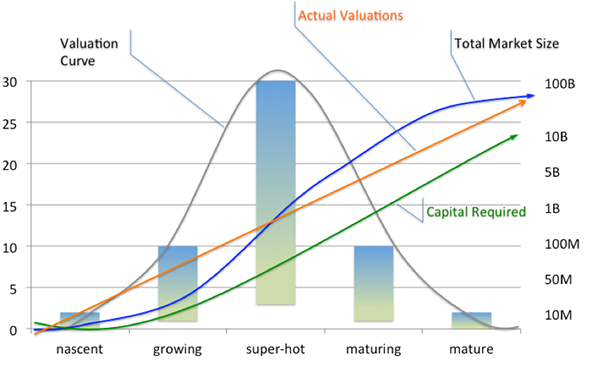
Figure 1: The Startup Market Lifecycle: The stages and curves
The most important curves in this model are:
- The Valuation Multiple Curve, which defines the multiples for exits and financing
- The Actual Valuations curve, which is the sum of the valuations of the companies in the market
- The Total Market Size curve, which is the sum of all the revenue being generated in the market
- The Capital Required curve, which shows the amount of money needed to break into or become a leader in the market
Not understanding fully what stage your market is in can have dire financial ramifications for entrepreneurs and investors, while correctly assessing the stage can give you a leg up on when to enter, expand, or exit a market.
The Stages of Evolution of Startup Markets
Let’s look at the stages and some characteristics of each of these stages, and what each curve represents in these stages.
Nascent. Most markets begin in what I call a “nascent” stage. This means that there is an interesting new market based on new technology or standard. These technologies are usually being played with by hobbyists or researches, but generally speaking, they haven’t yet hit the radar of professional venture capitalists, and are not yet considered “the next big thing.” During this stage, while it’s great to get into a market and become a thought-leader, you generally have to be able to support yourself doing something else or by doing contract work. If you present a company in a nascent market to a VC, all but the most visionary of VCs will probably say: “Huh? I’ve vaguely heard of this technology, but the market is too small right now. Let’s see how/if this develops into a real market—keep us updated on your progress.”
Looking at the World Wide Web, this would be when the first web browsers were being developed in Urbana Champaign in the early 1990s would be the nascent stage. Bitcoin in 2010 after it was invented by Satoshi Nakamoto but before the first major wave of hype in 2013, was a nascent market. Valuations at this stage are tough because there are very few metrics they can be based off of. The Capital Required is also relatively small, as is the market size.
Growing. When one or more startup companies in a market start to experience rapid growth (either actual growth as in revenue, or customers, or projected growth by analysts and VCs), it is usually accompanied by an “echo chamber” about how this is the “next big thing” in Startup-Land. Many companies that eventually become dominant players in markets are actually started during the first part of the “growing” stage. There is, in the second part of this phase, at first a slow drip and then a rush from big companies and VC’s to put money into this space or to plug the hole that’s been revealed in their portfolio (for VCs) or in their product lines (for big companies). This leads to aggressive valuations (3-5 times revenues isn’t uncommon), and if it continues overheating, to the next stage. Many VC’s started to invest in web-related companies in the early 1990’s, looking for ways to commercialize the World Wide Web. The surest sign of this phase is that multiple VCs either have invested in this space or are looking to find an investment.
Super Hot. Some markets make it mainstream quickly, some do it over a larger period of time. But there is an unusual period, which happens in high tech startup markets, where big players and VCs alike realize that they are “behind the ball” and need to get into this market. This is when outsized valuations happen – I have seen 100+ multiples on revenues during exits in this stage, though 5-10 times revenues is more common. Sometimes it’s when an event (the Netscape IPO in the web, the sales of ngmoco for $400 million in mobile gaming in late 2010, the sale of Oculus to FB for $2 Billion) which kicks off this phase, which is often short-lived. In the super-hot phase, investors and big companies, will put money into and acquire companies quickly because they are afraid that if they wait, valuations will go up even more and they will miss out. Actually, FOMO (Fear of Missing Out ) and NBT (Next Big Thing).
Maturing. At some point, rationality comes back into the market, and there are signs that the market is maturing. Usually this is when people realize that companies have been over-valued, and the valuations come back down to earth. There is still a great opportunity to make money during the beginning of this stage, but if you wait until the latter part of this stage, acquirers and VCs take on different behavior patterns. Many acquirers have already placed bets in this space, while other acquirers want to see how you actually perform (profitability) and are usually willing to give only decent multiples rather than outsized multiples. The first signs of this are when multiples go back to the 3-5 revenues, which are still aggressive, but not overheated. As an example in mobile gaming, Funzio was acquired for $200 million in 2012, which seemed like a lot of money, but represented a multiple of only 4 times since their revenues were approximately $50 million.
As acquirers and investors realize there are too many startups in this market, they are all willing to wait to see who the winners are, because they believe the valuations may actually be coming down. VC’s are hesitant to make any more bets in this space, unless a company has unusual traction. This usually starts to happen after some event brings rationality back into the market, or there are clear winners. For example, the dot com crash in 2000 in the “internet market,” the dominance of Google in “search,” and in the mobile gaming market, the crash of Zynga’s stock in 2012.
Another key aspect of this stage is that getting into the market requires a significantly higher investment, both in terms of product development and user acquisition. As an example, when we built Tap Fish, we spent $25,000 on development and $25,000 on user acquisition at 25 cents per user. As the market moved into maturing in 2012 onwards, user acquisitions costs were easily in the $1-$3 per user, making it much harder to do profitable user acquisition. Also, the flood of entrants in previous stages makes it very difficult to differentiate your product or service at this stage. Finally, companies like Kabam and others who became leaders in mobile gaming were consistently spending more than $1 million (in some cases, $10 million) in building mobile games—a far cry from the early days of the market and a sure sign that the market was maturing.
Mature. When a market matures, the emphasis has shifted from growth to profitability in a given market. Companies start to be valued more based on profits than revenues, and there are several established players who have made names for themselves as leaders. When I was in Stanford Business School, most of what we learned was tailored towards companies that are in this stage of the market (NPV, or net present value of cash flows), and equilibrium of supply/demand pricing in the market. All of the rules of big companies that were ignored during the initial phases of the startup market now become the norm. Eventually, investors in game companies or Internet companies started to look for profits and start to value the companies based on those (sometimes non-existent) profits.
The Various Curves and the Startup Opportunity Curve
As a market grows and matures, while the multiples for valuations of companies goes down, the actual valuations of the market leaders keep going up, as does the market size. Because most of the revenue tends to be concentrated in a handful of companies, you can usually approximate both curves just by looking at the top 5 or 10 companies in the startup market. At some point, the actual valuation curve and the market size curve cross. This is typically a sign that the market is maturing. For example, Facebook had a $100 billion market at one point after its IPO, but was the market for social media advertising (which they were dominant in) worth this much at the time? Probably not, but over time, as Facebook grew its revenue from $1 billion to $20 billion run rate recently.
After mobile gaming started to mature after 2012, the total valuations climbed into the billions (including Rovio, Supercell, King.com, and many others), and eventually so did revenue with games like Pokemon Go and Fortnite.
This brings us to the most important curve in this model: the Startup Opportunity Curve, shown in Figure 2.
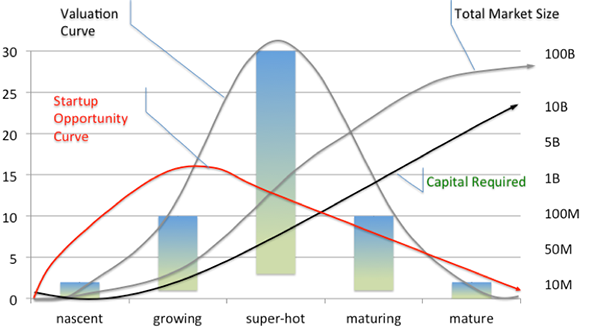
Figure 2: The Startup Curves
While it’s possible, as we saw with Tesla, to make an impact on a mature market, the capital required is often prohibitive (Elon Musk spent $180 million of his own money) for new entrepreneurs. This is a far cry from the entrepreneurs in Detroit in the 1920s working in garages.
While the nascent stage is the easiest to get into a market, the danger is that the market never gets to subsequent stages. The best time to get into a market is during the first part of the growing stage. At this stage, there is some recognition that the market may be real, investors are typically free with money and are actively looking to place bets in this market, most larger companies have not yet done anything in the market. By the time a market is super-hot (which is by the way, when most prospective entrepreneurs jump into a market), it is usually too late.
Startup markets are different than traditional markets, and much of what we learn about in business school doesn’t always apply: supply, demand, cash flow, net present value, etc.
Because startup markets evolve so quickly, it’s possible that assumptions that hold in one month do not hold even a few months later. That’s why the Startup Market Lifecycle model presented here is based on the evolution of startup markets through similar stages.
Using a combination of these curves and the stage of the market, conclusions can be easily drawn about the best time for investors to invest in markets, and for entrepreneurs to sell their companies in newly emerging markets.