

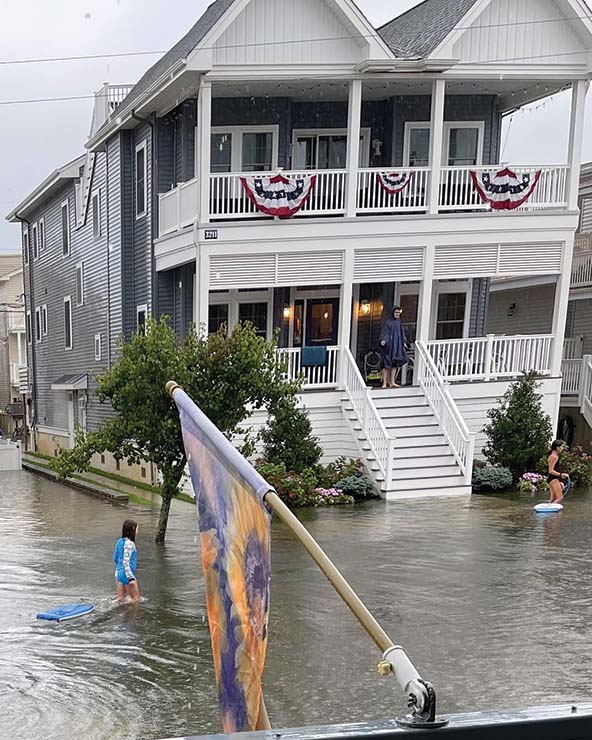
 Increased flooding events in Ocean City, New Jersey, led to a community group’s civic science effort. (Photo courtesy of Roseanne Monfardini)
Suzanne Hornick has spent countless summers in Ocean City, New Jersey, where her family has owned a beach home since the early 1940s. Over the years, she noticed a rare quirk of the island become a serious problem: On hot, sunny summer days, her street would flood with seawater.
Ocean City is part of a stretch of the East Coast where the sea level has risen at its fastest rate in a century, according to a 2021 Nature Communications study. Today, the sea level is 5 to 8 inches higher on average than it was in 1900.
Concerned about the rising sea level, Hornick founded the Ocean City Flooding Committee in 2014. Yet, despite repeated petitions, the committee could not persuade the Ocean City Council to take up the issue. So, in 2018, Hornick turned to the American Geophysical Union’s Thriving Earth Exchange, an initiative that connects communities with scientists to find solutions for climate-related challenges. The committee was matched with the associate director of the Urban Coast Institute at Monmouth University, Tom Herrington, who recommended the data-gathering tool ISeeChange to help them collect the evidence they needed to persuade the authorities to take action.
ISeeChange is a free digital platform where people can post photos and stories about how their communities experience climate change. The platform’s technology “picks up what climate topic their observations fall under,” ISeeChange’s founder and CEO, Julia Kumari Drapkin, explains, which prompts users to share more information, including specific measurements such as rainfall totals and temperature readings. The aggregated posts are then synced together in conjunction with existing scientific research to produce new, localized data, which communities can use to inform politicians and policy makers as well as to help them design policy and infrastructure solutions targeting specific areas.
In 2019, the more than 5,000 members of Ocean City’s Flooding Committee posted photos and stories on ISeeChange’s platform, including their own measurements taken from tide gauges, to demonstrate the extent of the flooding. The data collection and analysis effort proved that “very minor rain events combined with very minor tidal events were creating significant flooding” in the community, Drapkin observes. In fact, members measured flooding at a level that was more than double the National Ocean Service’s prediction for sunny-day flooding events.
ISeeChange continued to work with the committee to create a map of the flooding based on community members’ data. The map allowed constituents to pinpoint specific streets where flooding was happening, revealing that the data from the New Jersey Department of Environmental Protection (NJDEP) about flooding was incorrect. With accurate and abundant data, the committee was able to approach and assist their city and state representatives to identify specific solutions.
For Hornick, ISeeChange “was tremendously helpful to bridge the gap not just between the city and the citizens, but the state and the citizens, as well as the scientific community and the citizens.”
Local Reporting
The idea for ISeeChange took shape in 2011 when Drapkin, then a climate science reporter, urged friends who were staff at the US Office of Science and Technology Policy to put pressure on Congress to address climate change.
“They said, ‘Well, I can’t go to a congressperson and say that this is how much climate change costs your district,’” Drapkin recalls, because they couldn’t narrow down information on a geological scale to individual experience. “I realized I was the same problem as a reporter,” Drapkin adds, which made her wonder if there was a way to collect people’s experiences with climate change and use their stories as data.
In 2012, Drapkin pitched the first iteration of ISeeChange as a reporting project to Localore, a public media production of AIR Media. Localore assigned Drapkin to a local radio station in western Colorado to report the stories of climate change in farming towns and rural communities. The residents were keen observers of their environment and how it was changing because they lived much of their lives outdoors. For instance, Drapkin notes that “people were reporting that they were fighting wildfires in snow in March”—months before the devastating 2012 wildfire season burned nearly 385,000 acres and caused at least $538 million in property loss.
Drapkin drew inspiration from the farm journals residents maintained that were full of “granular, quantifiable information, and qualitative story information” about weather patterns dating back decades. “I realized that I wanted to create a guide for all of us to understand climate change and what was coming, and to guide our response—to be this resource we could all use to make decisions,” Drapkin explains.
With funding from Localore, Drapkin and UX researcher and designer Lindsey Wagner, who she met while both worked at Localore, created the prototype for ISeeChange in February 2013—coincidentally, the same month that their funding ran out. Their public media project documenting the stories and images from rural Coloradans attracted international media attention, including that of NASA’s Jet Propulsion Laboratory. In 2015, NASA contracted with ISeeChange to develop a platform to sync every post about users’ local environments to the carbon measurements taken on its Orbiting Carbon Observatory 2 mission. This project helped Drapkin to understand ISeeChange’s potential as an educational resource “to teach youth how the weather they’re experiencing right now is not the weather their parents or grandparents experienced,” she says.
She also recognized that ISeeChange’s data could be wielded to help marginalized communities lacking the resources to address climate change. For example, in 2016, ISeeChange coproduced the Harlem Heat Project (HHP) with public radio station WNYC and environmental nonprofits AdaptNY and WE ACT for Environmental Justice. HHP is a public media project that records the public health risks of urban heat. Harlem residents recorded data from temperature sensors placed inside their apartments in their stories on ISeeChange’s platform. The evidence showed that indoor heat waves caused Harlem buildings to heat up three days before the National Weather Service issued heat alerts and were at more dangerous heat thresholds up to a week after a heatwave subsided. The personal stories combined with quantitative measurements “really moved the needle on many things,” Drapkin observes, noting that New York City officials are now working on improving its cooling centers.
Citizen Science
ISeeChange’s community-level, qualitative approach to data collection is important not just because it has led to policy change and solutions but also because of its promise for future learning. Herrington believes that the platform’s unique value resides in its ability to add “a kind of contextual impact to what’s going on in the community by showing the granularity of how [climate change] is changing people’s lives,” and in how solutions can “change those impacts in a way that makes sense for the community and the state.”
Drapkin hopes that community members will be inspired not just to call for change but also to become actively involved in designing solutions. The traditional public design process, she says, is “for the people who have the time and resources to show up for meetings.” In contrast, ISeeChange provides “a way for people, without taxing their time and resources, to participate.”
While funding hasn’t been easy, ISeeChange is now able to support its work through a diversified set of sources, including grants, convertible notes from energy utilities like energy provider Exelon, and contracts with clients ranging from municipalities to engineering firms and even science museums. Since Stantec Engineering became a major client in 2018, ISeeChange has continued to secure more enterprise contracts as it scales its platform.
“It’s not an easy market,” Drapkin says, noting that she sees room for improvement in procuring “private-public partnerships in particular.” She has been interested in raising venture capital, but she faces barriers as “a woman of color [who is] not from Silicon Valley,” she says. “I can’t walk into a boardroom with a back-of-the-napkin idea the way some others can and get funded.”
ISeeChange’s location in New Orleans has made it difficult to attract Silicon Valley-based funders. But Drapkin deliberately chose the city to reflect the company’s dedication to equity. “When you’re designing climate solutions from computers in Silicon Valley or New York, you’re not working with the people who are most impacted, who are living with climate risk every day,” Drapkin explains.
Another challenge is that “the majority of tech right now is focused on taking people out of the equation,” Drapkin says, while “the fundamental problem when it comes to climate change is people-centered.” Tech often interprets the reliance on people as a data source as inherently flawed, Drapkin says, although tech-based solutions like AI and machine learning—which draw significant funding—are statistically full of errors. “There are so many ways that we can validate and verify people’s experiences more accurately than AI,” she adds.
Despite these obstacles, ISeeChange is increasingly used by communities and cities across the United States. The city of Miami uses the platform as its primary flood-reporting tool, and the city of New Orleans uses ISeeChange for documenting increasing temperatures. With Boston’s Museum of Science, ISeeChange is working with 15 science museums across the country for a project on climate engagement and data collection. In 2021, ISeeChange expanded into Canada, working on a climate impact adaptation plan for a city in Ontario.
At the heart of all ISeeChange’s projects is the core idea that “you can move mountains when you have a community at scale telling their stories alongside data,” Drapkin says. “Because you can’t refute them.”
Read more stories by Julie Zeilinger.