
Data is an asset nonprofits can use in a variety of ways—to create more effective programs, to spread the message about what they do, and to bring people together. For nonprofits that want to create a visual of their data to achieve one of these goals, there is a flabbergasting array of possible tools. Every few days I get an email about some amazing new data visualization tool that I just have to try. But how do you make an appropriate and effective choice?
At SSIR’s Data on Purpose conference earlier this year, I led a workshop on storytelling with data. An important part of telling your organization’s data story well is picking the right storytelling technique for your audience. Here’s a quick introduction to how nonprofits, big and small, can approach telling their data-driven stories appropriately and effectively.
Going from Data to Story
People are experimenting with lots of ways to break down the process of transforming large amounts of data into a clear presentation. Journalist and Professor Paul Bradshaw has his inverted pyramid for data journalists; the School of Data, which aims to help civil society use data effectively, has its “data expedition” hexagons; and the innovation lab Visualizing Impact has a “process wheel.” I've got my process line:
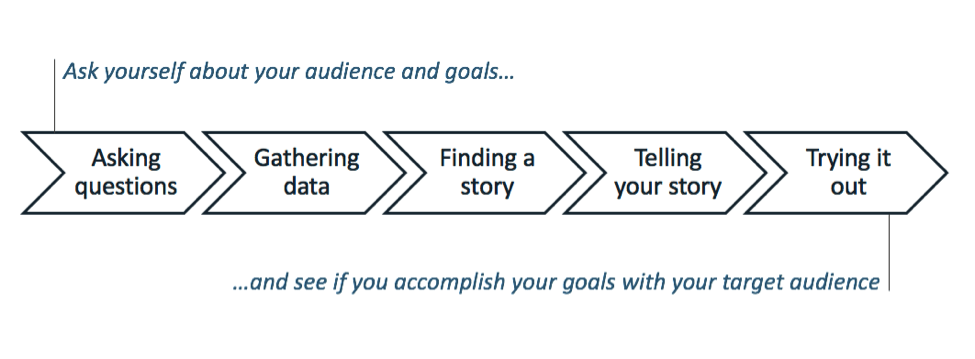 A process to go from data to story.
The most important point in this line is the first step: asking yourself some questions about who your audience is and what your goals are. The answers to these questions give you criteria for your decision about how to tell your data-driven story. You shouldn't have your board play an interactive data-driven game to show them this year’s impact, just like you shouldn't try to get folks on the street excited about a bar chart. Bar charts are the default simply because they are easy to create in tools like Excel, not because they are the best way to tell an every data story. In fact, most of our go-to storytelling techniques are sadly limited by the technologies we use. But if we open our eyes, it’s possible see a richer set of inspirations that we might apply to effectively communicate with a wider variety of audiences.
Finding Inspiration
Standard data storytelling workshops encourage organizations to share beautiful visualizations of data. Images like these can inspire people and demonstrate expert approaches, but they can be hard to read and are super hard to create! Complex visualizations depend on your audience being interested enough to spend time learning how to read what you’re created.
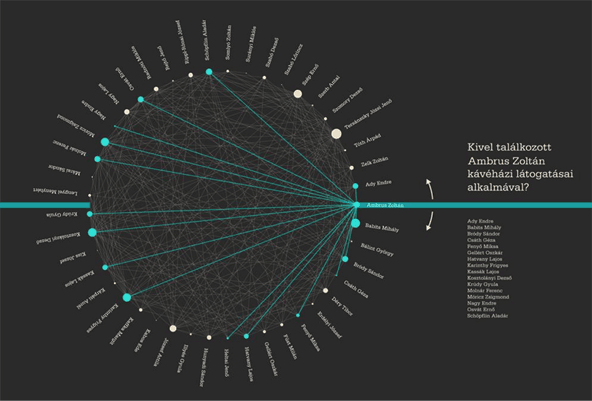 Complex visualizations can both inspire and intimidate. (Visualization by Krisztina Szucs)
Looking back at history, we can see an enlightening example of data storytelling in the work of Elizabeth Peabody (brought to my attention by Lauren Klein). Peabody, in the mid-1800s, was creating abstract visualizations of American history and taking them on tour as giant quilts, physically gathering students around them to talk about important historical drivers and events. This novel, graphical depiction and the social context around it is a great inspiration to keep in mind. In a similar vein, as part of my Data Therapy project we have been painting data murals around the world. The process for creating a data mural involves identifying important data, bringing together stakeholders to find a story they want to tell based on that data, collaboratively designing a large visual to tell that story, and then bringing the community together to paint it as a mural.
Remember you can do more creative things, like laser-cutting data about food security into vegetables for a large public event about food. The audience at the event was predisposed to be uninterested in food security, so I needed something to get their attention. The unique presentation of qualitative and quantitative data brought people over and primed them to ask questions about the data in hand (literally).
 Elizabeth Peabody brought people together around historical visualizations she created on giant quilts. (1856 - Image by the Digital Humanities Lab at Georgia Tech)
You can see a commercial example of this kind of data representation in the Prudential Ribbon Experiment ads for retirement services, where people represent the data in a setting that creates a collective, real-world visualization. Another approach is to build "data sculptures" and give your data a physical form. One example is the World Wildlife Fund’s depiction of car exhaust emissions data during the Beijing climate talks.
 Laser-cutting food security data into cucumbers and other vegetables for a food event got people talking.
Taken together, these examples help flesh out a wider set of techniques beyond simple charts and graphs.
Picking the Right Technique
So how do you pick the most appropriate and effective way to tell your data-driven story? I'm sorry to say I have no hard and fast rules you can follow. That said—going back to the first step of my process line—you can start by defining some characteristics about your audience and your goals. Consider:
- Are you trying to denote authority or start a conversation? If you want to convince people you're correct, then by all means use a formal presentation technique like charts and graphs on a projector; if you want to spark questions, go informal.
- Is your audience already interested in the topic? If your audience isn’t primed and thinking about the data you're telling a story about, then you have to choose a technique they can relate to in order to pull them in.
- Does your audience agree or disagree with you already? If your audience disagrees with you, then you have to find a new way to find a middle ground or provoke them into thinking about the issue differently.
By paying attention to your audience and what presentation techniques might work for them, you'll be able to tell a better data story.
Read more stories by Rahul Bhargava.